Review Decision
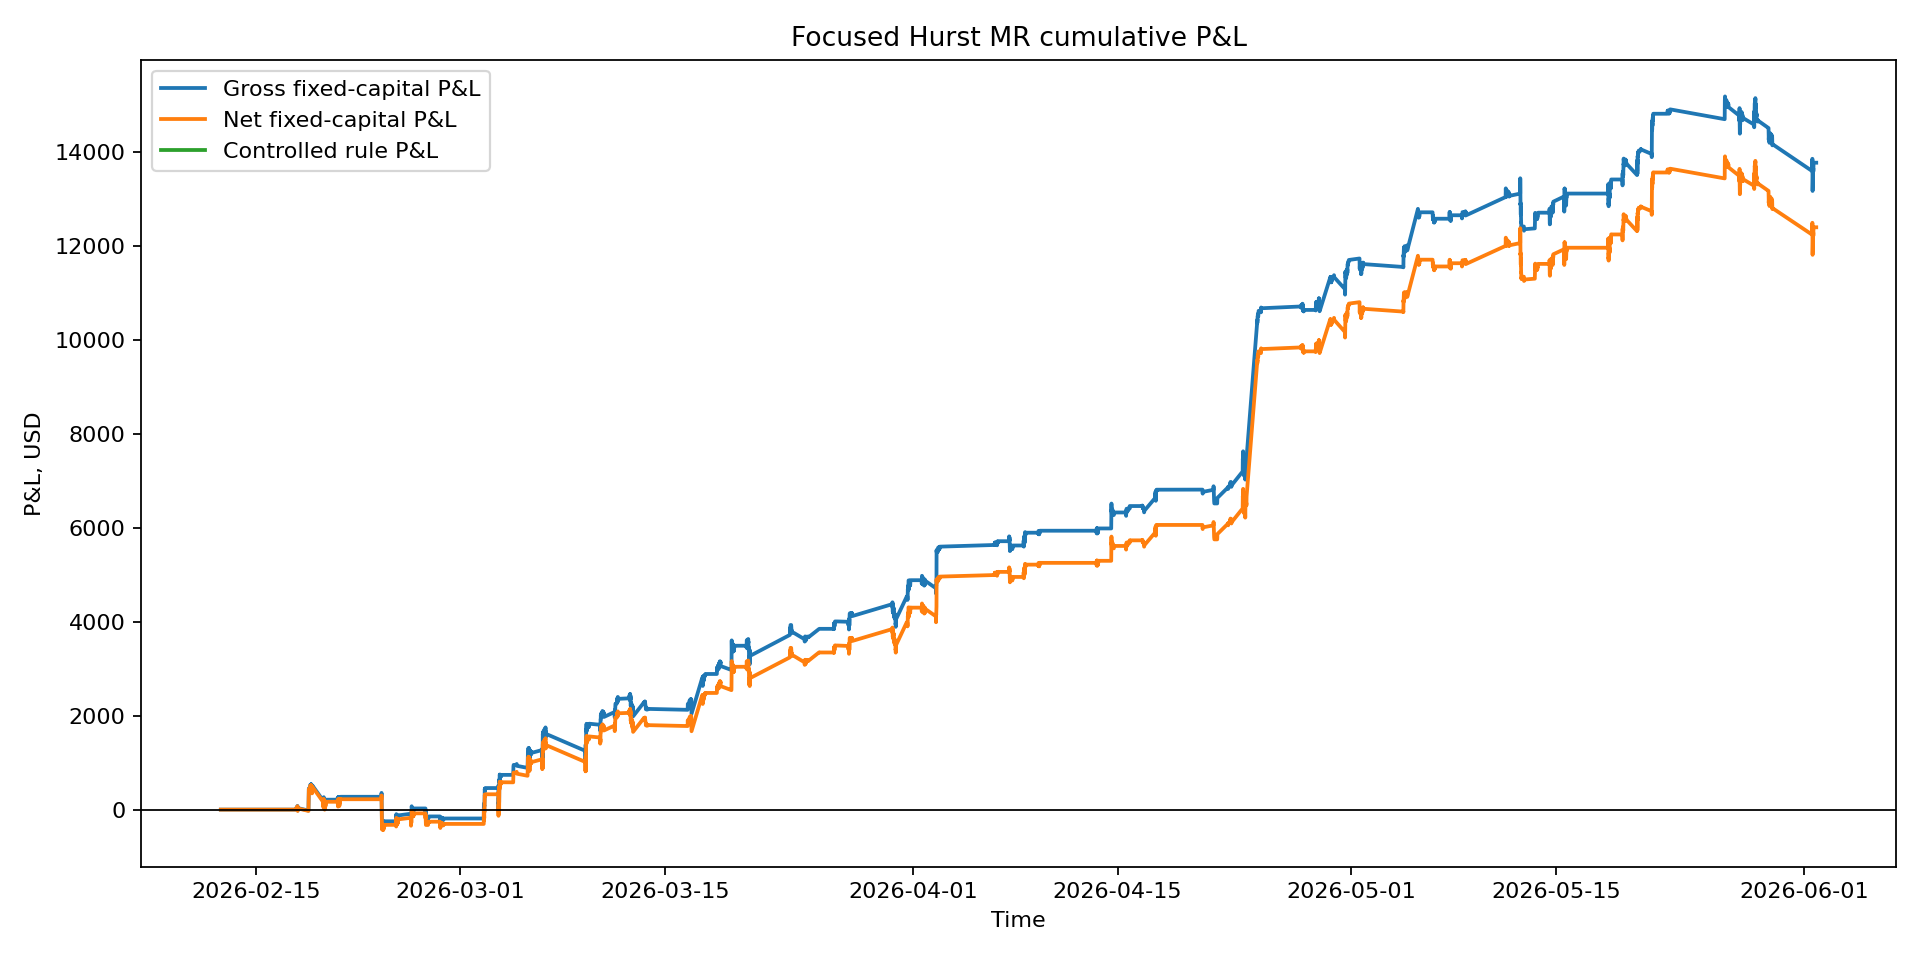
P&L Curve
Shift Test vs Causal Replay
The shift heuristic tests whether using future positions improves Sharpe. This is useful for many momentum/ranking systems, but it can fail on mean-reversion systems because tomorrow's entry often follows today's adverse move, so the lead-position cheat can make performance worse instead of better.
| ticker | compared_bars | position_diff_count | max_position_diff |
|---|---|---|---|
| FOXA | 4835 | 0 | 0.0 |
| WMB | 4835 | 0 | 0.0 |
| HON | 4835 | 0 | 0.0 |
| QCOM | 4835 | 0 | 0.0 |
| INTC | 4835 | 0 | 0.0 |
| FTV | 4835 | 0 | 0.0 |
| KMI | 4835 | 0 | 0.0 |
| VLTO | 4835 | 0 | 0.0 |
| MGM | 4835 | 0 | 0.0 |
Why Return And Drawdown Look Low
The strategy is not usually fully invested. Average gross exposure is only 12.00%, max observed exposure is 66.67%, and at least one symbol is active on 60.34% of bars. So dollar P&L and drawdown are low because most capital is idle most of the time.
Scaling notional linearly would scale dollar P&L and dollar drawdown roughly linearly while percent return on the stated capital base rises only if we intentionally use more of the idle capital. Sharpe is scale-invariant only before market impact, borrow/financing constraints, liquidity caps, and fill slippage.
Assumptions
- Data: Alpaca SIP 5-minute bars, regular US session only, 5850 bars per symbol.
- Execution model: signal evaluated after bar close; position applies on the next bar.
- Costs: 2 bps per position change. No bid/ask queue, latency, or partial-fill simulator.
- Capital: fixed $10,000 per symbol, $90,000 total. Official eval also shows compounded NAV returns.
- OOS split: 2026-05-12, representing post-original-research/paper-observation period, not a hidden holdout.
OOS Split
Current Paper Execution Rules
| case | ticker | strategy | orders | entries | exits | blocked_entries | exposure_pct | pnl_usd | return_pct | sharpe | max_drawdown_usd |
|---|---|---|---|---|---|---|---|---|---|---|---|
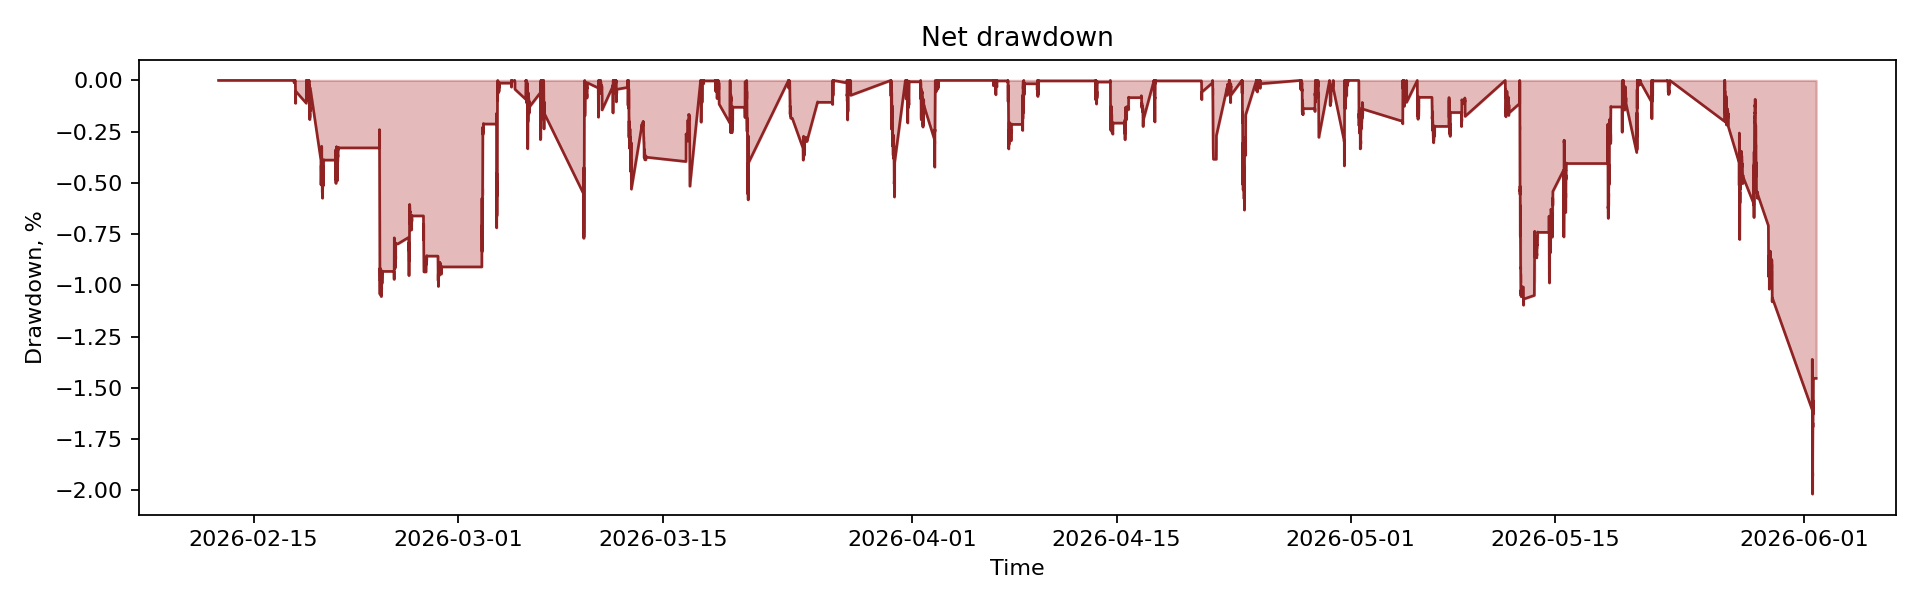
| baseline_portfolio | PORTFOLIO | focused_basket | 600 | 300 | 300 | 0 | NaN | 11699.26 | 13.00 | 5.343 | -1829.02 |
| cooldown30_max4_portfolio | PORTFOLIO | focused_basket | 550 | 275 | 275 | 133 | NaN | 10605.72 | 11.78 | 5.053 | -1469.15 |
Strategy-Eval Gate
- Official operational reliability: shift-lookahead heuristic failed. Truncate replay passes, but the official P0 gate remains conservative.
- DSR/PBO: needs input; no candidate trial panel or walk-forward panel supplied.
- Factor exposure: computed against SPY_market only; beta 0.148, R2 0.072. Full factor model still missing.
- Portfolio interaction: needs existing strategy returns; no max-correlation conclusion yet.
- Paper/fill readiness: needs paper return stream and fill/latency/spread model.
Open official eval dashboard · Bias report · Internal report · Summary MD · Causal replay JSON
Per-Symbol 5m Backtest
| ticker | sharpe | total_pnl_usd | total_return_pct | max_drawdown_usd | trades | win_rate | exposure_pct |
|---|---|---|---|---|---|---|---|
| FOXA | 4.380 | 1389.58 | 13.90 | -186.93 | 33 | 0.758 | 11.38 |
| HON | 3.559 | 1100.58 | 11.01 | -246.03 | 29 | 0.793 | 10.09 |
| FTV | 3.558 | 1325.08 | 13.25 | -433.62 | 32 | 0.750 | 10.12 |
| WMB | 3.246 | 788.12 | 7.88 | -292.03 | 26 | 0.846 | 9.52 |
| MGM | 2.529 | 1217.52 | 12.18 | -519.48 | 34 | 0.706 | 10.09 |
| INTC | 2.378 | 4054.73 | 40.55 | -1011.09 | 40 | 0.625 | 13.76 |
| VLTO | 1.954 | 1009.68 | 10.10 | -499.56 | 38 | 0.737 | 16.26 |
| KMI | 1.401 | 380.23 | 3.80 | -536.27 | 30 | 0.667 | 12.53 |
| QCOM | 0.933 | 433.74 | 4.34 | -651.95 | 38 | 0.579 | 14.29 |
Common Daily Horizons
Daily multi-horizon scan from the existing research artifact; this is a broader daily proxy, not the 5m SIP strategy itself.
| horizon | tickers | positive_tickers | avg_trades | total_pnl_usd | return_pct | sharpe | max_drawdown_usd |
|---|---|---|---|---|---|---|---|
| 1m | 80 | 29 | 0.71 | 11784.21 | 1.47 | 4.511 | -4074.71 |
| 3m | 80 | 39 | 1.50 | 22371.22 | 2.80 | 2.780 | -14283.83 |
| 6m | 80 | 50 | 2.62 | 30705.48 | 3.84 | 2.158 | -13995.05 |
| 1y | 80 | 58 | 4.17 | 65193.33 | 8.15 | 2.591 | -11579.68 |
| 3y | 80 | 64 | 10.18 | 157914.51 | 19.74 | 1.462 | -29418.13 |